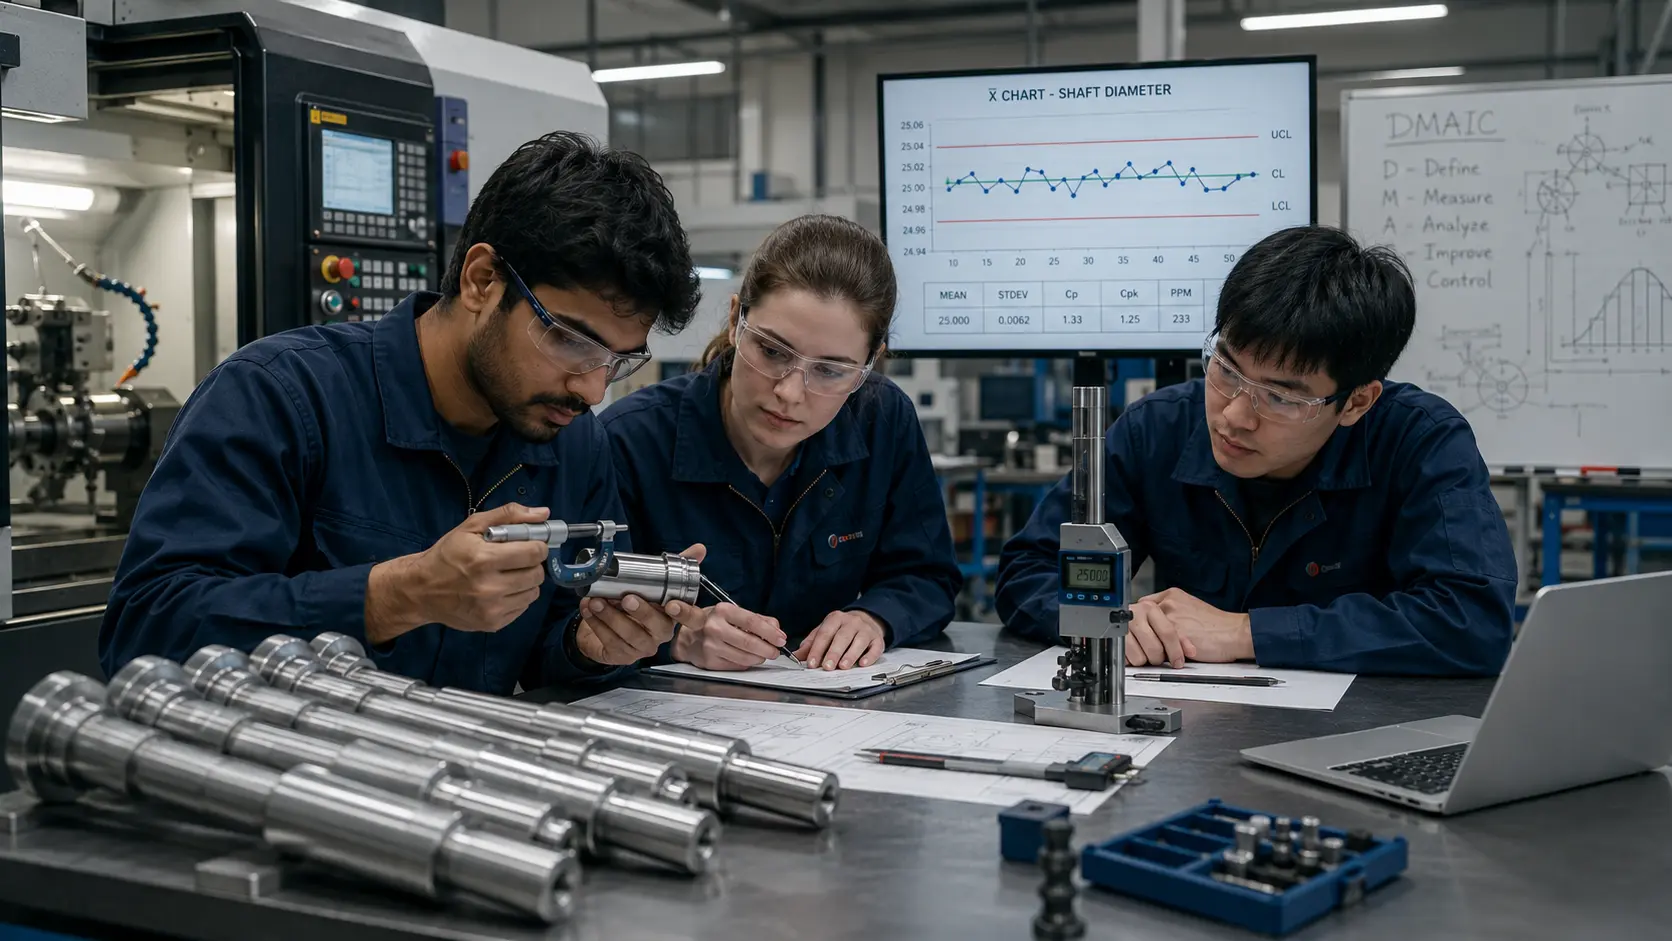
Imagine a CNC turning process that produces shafts with a specified diameter. Most components pass inspection. Some do not. The immediate reaction might be that the machine needs adjustment — but the cutting tool could be wearing, the setup could be inconsistent, measurement could be unreliable, material could be changing, temperature could be influencing the cut, or one machine could simply be behaving differently from another. Without evidence, those are all just hypotheses.
This is where Six Sigma becomes useful. It is often introduced to engineering students through sigma levels, defects per million opportunities, belts and statistical terminology. Those concepts belong to the broader Six Sigma body of practice, but they can make the subject look more complicated than its central engineering idea.
ASQ describes Six Sigma as a fact-based, data-driven approach to process improvement that seeks to reduce variation and defects, with a strong emphasis on understanding the relationships between process inputs and outputs. For students, a practical way to understand it is simpler: use evidence to understand why a process is inconsistent, improve the causes that matter, and verify that the improvement remains effective.
DMAIC provides the structure for doing that.
What does DMAIC mean?
DMAIC stands for Define, Measure, Analyze, Improve, Control. ASQ describes it as a structured approach for improving existing processes that are not meeting expected performance or customer requirements. ISO 13053-1:2011 — currently the published international standard for this methodology — similarly defines Six Sigma DMAIC through these five stages and sets out recommended practice for conducting Six Sigma improvement projects.
The phases are not arbitrary. Each one exists because engineering investigations fail when teams move too quickly from problem to solution. DMAIC forces several questions to be answered first.
The DMAIC Engineering Question Chain
One way I find it useful to hold the five phases together, as an explanatory framework rather than an official ISO or ASQ model, is as a chain of questions — each one has to be answered credibly before the next one is worth asking.
“Question first. Tool second.”
That sequence is more important than memorizing a list of Six Sigma tools.
Six Sigma is fundamentally about variation
Consider a shaft with a required diameter of 20.00 ± 0.05 mm. The engineering specification allows anything from 19.95 mm to 20.05 mm. Now consider two fictional processes producing that shaft.
| Sample | Process A (mm) | Process B (mm) |
|---|---|---|
| 1 | 19.99 | 19.95 |
| 2 | 20.00 | 20.04 |
| 3 | 20.01 | 19.97 |
| 4 | 20.00 | 20.05 |
| 5 | 20.01 | 19.99 |
Both processes have averages reasonably close to 20.00 mm. But they do not behave the same way — Process A is tightly clustered, Process B varies much more widely. That matters because a process with large variation is more likely to produce output outside specification, which leads to one of the central Six Sigma questions: how consistently does the process produce the required result? The average alone cannot answer that.
Variation exists in every manufacturing process
No manufacturing process produces mathematically identical output forever. Variation can come from machinery, tooling, material, measurement, environment, setup, people and operating conditions. The engineering task is not to pretend variation does not exist — it is to understand what variation is normal, what variation indicates abnormal behaviour, and whether the remaining variation is compatible with product requirements. That is where statistical process thinking becomes useful.
Common-cause and special-cause variation
ASQ's statistical process control guidance distinguishes two broad types of variation. Common-cause variation is inherent in the normal process — small, routine differences in material, tool condition or temperature. Special-cause variation results from unusual influences that cause the process to depart from its typical behaviour, such as a fixture that suddenly loosens.
The difference matters because the engineering response should be different. If one unusual defective part appears because a tool insert chipped, replacing the insert may address that special event. But if shaft diameter continuously varies too widely because the process itself has poor stability, changing one insert will not solve chronic variation — and blaming an individual operator for variation that is inherent in the whole process will not improve it either. The first engineering task is to understand what kind of problem exists.
Phase 1: Define
DMAIC begins by clearly defining the problem. This sounds simple; it rarely is. "Quality is bad" does not say which product, which dimension, which machine, which customer requirement, or how often. Without a clear problem definition, an improvement project can expand into everything.
A better statement might be: final inspection has identified recurring out-of-tolerance shaft diameters from a CNC turning operation. Now the problem has a technical focus. ASQ's DMAIC guidance describes Define as establishing the problem, project goals, scope and customer requirements.
Six Sigma often uses the term Critical to Quality, or CTQ, to translate a customer statement like "the shaft must fit the bearing correctly" into measurable characteristics — potentially shaft diameter, roundness or surface finish. This translation matters because improvement requires measurable definitions; a vague complaint cannot be analyzed statistically until it is connected to something observable.
Scope matters too. Suppose a factory produces ten different shaft designs across four machines, and the defect appears on only one component, one operation, one machine. A poorly scoped project might investigate the entire machine shop; a stronger DMAIC project establishes boundaries that keep data collection and analysis relevant.
Phase 2: Measure
Once the problem is defined, DMAIC asks how the process is actually behaving — not how the team thinks it behaves. Possible manufacturing data include diameter, surface roughness, temperature, pressure, cycle time, defect frequency, downtime and cutting load. The Measure phase establishes a baseline, and without a baseline there is no credible way to demonstrate improvement.
Imagine a team immediately changes cutting speed, tool supplier, fixture and inspection method all at once, and output improves. Which change caused the improvement? Nobody knows — and the apparent improvement might simply be normal variation. DMAIC deliberately slows down the early part of problem solving: first understand current performance, then change the system. Without a baseline, improvement easily becomes opinion.
But can you trust the measurement?
This is one of the most important questions in manufacturing quality improvement. Suppose measured shaft diameter appears highly variable. The natural conclusion is that the machining process is unstable — but what if different inspectors obtain different readings because gauge positioning changes, instrument resolution is inadequate, or calibration is poor? Part of the observed variation may then come from the measurement process rather than manufacturing.
Measurement System Analysis exists to investigate this. ASQ's review of Gage R&R methods emphasizes that statistical process decisions depend directly on measurement quality, and that repeatability and reproducibility studies can help distinguish manufacturing variability from measurement-system variability — a point reinforced in the wider measurement-systems research literature. A useful engineering principle: before trusting the data, understand how the data were produced.
This idea extends beyond Six Sigma. A sensor is not an invisible truth generator — a measurement depends on the instrument, its calibration, its position, the operator or method, and the environment. That matters especially in mechanical engineering, because many process-improvement decisions depend on relatively small physical differences. If measurement variation is comparable with the variation engineers are trying to investigate, the analysis becomes difficult to trust.
My perspective on engineering data
I have encountered engineering situations where measurements changed my understanding of a problem — what initially seemed like the likely explanation was not necessarily what the evidence supported once the process behaviour was examined more closely. That is one reason data collection should not simply be used to confirm what we already believe. Its real value is that it can force the investigation to change direction. DMAIC becomes useful when it encourages engineers to let the evidence challenge the original assumption.
Phase 3: Analyze
The Analyze phase asks why the problem is happening — which is different from what could possibly cause it. A team might generate candidate causes such as tool wear, machine condition, material variation, setup, temperature or measurement. That list is useful, but those are candidate causes. Analyze should move from possible to supported by evidence.
A fishbone diagram is useful for expanding thinking and classifying possible causes around machine, method, material, measurement, people and environment. But drawing "tool wear" on a fishbone diagram does not prove tool wear is responsible — it creates a hypothesis, and the next step is to investigate. This connects directly to root cause analysis for machine failures: brainstorming produces candidate causes, engineering evidence evaluates them.
A Pareto analysis of defect categories — undersize diameter, oversize diameter, surface defects, incorrect length, burrs — can help identify which categories account for most observed problems, so improvement effort is not spread evenly across problems of very different importance. The Pareto chart does not explain the cause; it helps answer where to investigate first.
A scatter plot comparing, say, number of components since a tool change against shaft diameter can reveal a relationship worth investigating further. But correlation does not automatically establish cause. If defect frequency is higher on the night shift, that does not mean the night shift causes defects — it might also process a different product, use tooling later in its life, run different material, or operate under different temperature conditions. The shift might be associated with the real cause rather than causing it. Engineering knowledge matters because statistical relationships need physical interpretation: what mechanism could explain this relationship?
Six Sigma sometimes becomes intimidating because students assume every project requires advanced statistics. It does not — the required method depends on the question and the data. Useful analysis can involve stratification, plots, Pareto analysis, 5 Whys and physical inspection; more complex problems may justify hypothesis testing, regression or design of experiments. ASQ describes a broad combination of qualitative and quantitative tools within Six Sigma and DMAIC rather than prescribing one tool for every project. The goal is not the most sophisticated method — it is sufficient evidence to make the correct engineering decision.
Phase 4: Improve
Now DMAIC finally asks what should change — deliberately the fourth phase, not the first. Many improvement efforts start here: a machine produces defects, and someone says buy a new machine. Maybe that is correct. But DMAIC first asks whether measurement confirmed the problem, whether the machine was actually responsible, and which input caused the output variation. If analysis demonstrates that dimensional drift strongly follows tool wear, purchasing another machine may be unnecessary.
The improvement should address the verified cause. If analysis supports that tool wear causes gradual dimensional drift, useful interventions might involve revised tool-life criteria, tool-condition checks, or automated compensation where appropriate — the solution now has a causal relationship to the problem. Compare that with "conduct more operator training": training may sound constructive, but if operator skill was not a contributing cause, it will not solve the problem. DMAIC protects against generic corrective actions.
Before applying a change across an entire plant, engineers can pilot it at controlled scale, asking whether the expected variable improved, whether variation reduced, and whether a new problem appeared. Increasing cutting speed to improve throughput might improve cycle time while increasing tool wear, degrading surface quality, or raising cutting temperature. A technically beneficial change in one metric can make the process worse elsewhere, so improvement has to be evaluated as an engineering system.
Phase 5: Control
Suppose the new machining strategy works. Is DMAIC finished? Not yet. Tools wear, people change shifts, materials change, machines are maintained, settings drift. Control is not optional after Improve — it asks how the improved condition will be sustained. ASQ describes Control as establishing ongoing measurement, reaction plans, standard procedures and process controls intended to maintain the improvement.
Control does not mean freezing the process forever. The objective is to know what good performance looks like, how deterioration will be detected, and what action should occur when behaviour changes — through standard work, control plans, inspections, preventive maintenance, process monitoring and control charts. The system can still improve again later.
A control chart plots process data over time relative to a center line and statistically determined upper and lower control limits. ASQ and NIST both describe control charts as tools for identifying whether process variation remains consistent, or whether unusual variation suggests a special cause — helping engineers distinguish ordinary process variation from evidence that something changed.
Specification limits and control limits are not the same
This is one of the most important concepts for engineering students. Specification limits answer: is this product acceptable according to its engineering requirement? They come from drawing requirements, design requirements or customer specifications. Control limits answer a different question: is this process behaving consistently relative to its historical, statistical pattern? They are calculated from process behaviour. NIST explicitly distinguishes control limits, as indicators of statistical process control, from specification limits, which relate to whether the product performs as intended. Confusing the two creates serious errors.
Imagine a process that consistently produces 20.07 mm shafts with very little variation. The process may be statistically stable — but if the upper specification is 20.05 mm, it is consistently producing unacceptable output. Stable does not mean capable; it means behaviour is predictable, and that predictable behaviour may still be wrong. Now imagine the opposite case: a process whose mean and variation change unpredictably because of special causes. Calculating a capability index for that process and treating it as a long-term property becomes questionable. NIST describes process capability as comparing the output of an in-control process with specification limits — the conceptual sequence is to understand stability first, then evaluate capability.
What is process capability?
Process capability asks: can the normal variation of this process fit within the engineering specification? The common indices are Cp and Cpk. NIST defines Cp as the ratio between specification width and approximately six standard deviations of process spread — conceptually, available specification width divided by process spread: Cp = (USL − LSL) ÷ 6σ. Cp considers variation, but it does not fully account for whether the process is centered.
Cpk additionally considers the position of the mean. NIST expresses it as the minimum standardized distance between the process mean and either specification limit, which means two processes could have similar variation but different Cpk if one has drifted toward a specification boundary.
Students should resist memorizing that a Cpk above some number is simply good, without understanding the process behind it. Capability analysis should only be interpreted when the relevant assumptions are reasonable — process stability, distribution, independence, sample adequacy. NIST specifically notes that the standard Cp/Cpk formulations assume an in-control process and normally distributed data. The engineering lesson: do not calculate an index before asking whether its assumptions make sense.
A fictional CNC DMAIC walkthrough
The following illustrative example — shaft diameter 20.00 ± 0.05 mm, with some components being rejected — is entirely fictional and intended only to show the DMAIC logic connecting together, not as a record of a real project.
- Define. The problem is stated as recurring out-of-tolerance shaft diameters at final inspection, with shaft diameter as the CTQ and the relevant turning operation as the project boundary — without assuming in advance that the CNC machine itself is defective.
- Measure. Data are collected for shaft diameter, tool usage, machine, material batch and relevant operating context, and the measurement system is reviewed, establishing current variation, current defect behaviour and a credible baseline.
- Analyze. Candidate causes — tool wear, setup variation, machine condition, material variation, temperature — are stratified against the data. In this fictional case, the analysis finds strong evidence that diameter gradually shifts as tool usage increases, while the other factors investigated do not explain the same pattern, moving tool wear from a possible cause toward a supported explanation.
- Improve. The team pilots a revised tool-life rule, periodic dimensional verification and clearer tool-change criteria, checking not just whether the mean improved but whether variation improved, whether reject behaviour improved, and whether any unintended effects appeared.
- Control. The improved procedure is documented, monitoring is established for shaft diameter and tool usage, and reaction criteria specify what should happen when performance begins to change — the improvement becomes part of normal process management.
That is DMAIC as engineering reasoning.
The DMAIC Evidence Rule
A simple way for students to remember DMAIC — again, my own explanatory framework rather than an official ISO or ASQ model — is to ask what evidence should exist after each phase. Every phase should change what the team actually knows about the problem, not just tick a box on a project template.
| Phase | Evidence that should exist afterward |
|---|---|
| Define | Evidence that the problem matters |
| Measure | Evidence describing current performance |
| Analyze | Evidence supporting the cause |
| Improve | Evidence that the change worked |
| Control | Evidence that the improvement remains effective |
Lean versus Six Sigma
Lean manufacturing and Six Sigma are often discussed together. They overlap, but the emphasis differs.
| Lean commonly emphasizes | Six Sigma commonly emphasizes |
|---|---|
| Customer value | Variation |
| Flow | Defects |
| Waiting | Process consistency |
| Inventory and overproduction | Measurable input/output relationships |
| Waste | Statistical control |
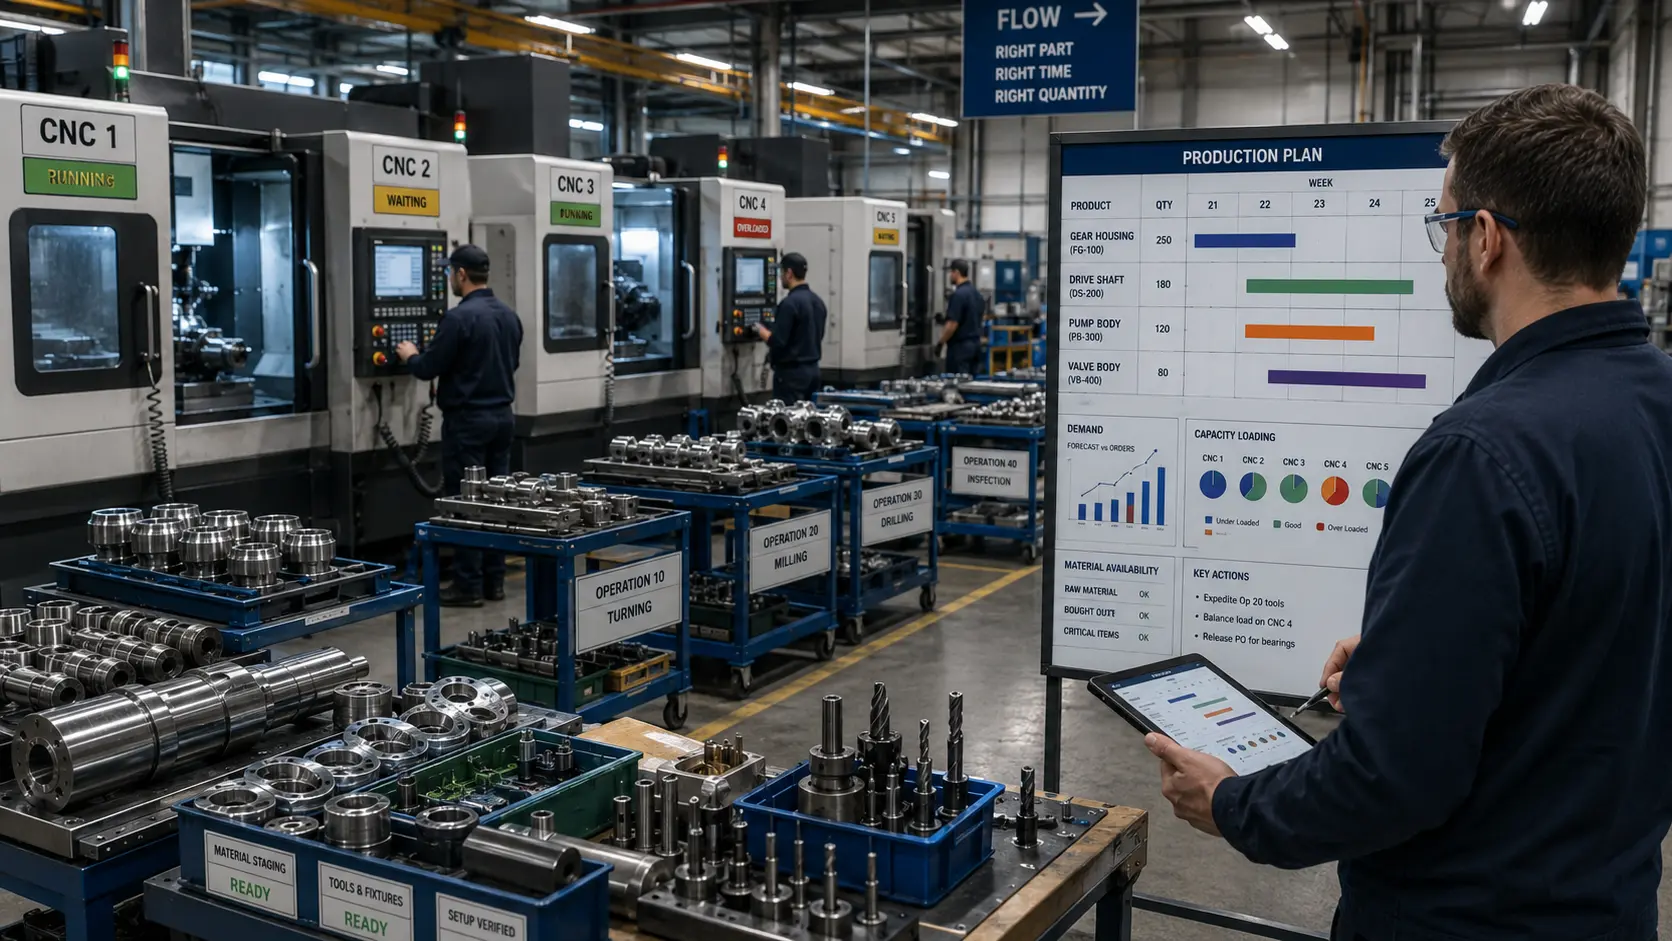
A useful simplified comparison: lean asks what is interrupting the flow of value; Six Sigma asks why the process is producing inconsistent outcomes. Real manufacturing problems, and the production-system thinking behind the Toyota Production System, often involve both — which is why Lean Six Sigma approaches integrate concepts from the two improvement traditions. ASQ also notes that DMAIC can be used independently or alongside lean improvement initiatives.
DMAIC and Root Cause Analysis
DMAIC and RCA are not the same method. Root cause analysis asks why a problem happened; DMAIC addresses a broader improvement sequence — define the problem, measure it, analyze causes, improve the process, sustain the gain. RCA tools such as 5 Whys, fishbone analysis and physical failure analysis can therefore appear inside the Analyze stage of a DMAIC project, but the same rule applies: possible causes are not automatically verified causes.
DMAIC and OEE
Overall Equipment Effectiveness can help identify where manufacturing performance is being lost. Suppose OEE shows strong availability and strong performance, but weak quality — that tells the team quality loss deserves attention, and DMAIC can then structure the deeper investigation: which defect is creating the quality loss, how often and under what conditions, which variables cause it, what change reduces it, and how the improved behaviour will be sustained. OEE identifies the performance area; DMAIC structures the improvement project.
DMAIC in digitally connected manufacturing
Modern manufacturing systems can collect far more data than traditional improvement teams had available, from PLCs, CNC controllers, sensors, machine-vision systems, MES and quality systems — including the kind of equipment-condition evidence covered in condition monitoring for rotating machinery. This can strengthen DMAIC, but it creates another danger: collecting everything simply because the factory can. DMAIC remains useful because it imposes a question structure — the Measure phase should gather the data required to understand the problem, and the Analyze phase should test meaningful relationships. More data are not automatically better evidence.
Suppose an AI model identifies patterns associated with product defects — that may be valuable, in the sense discussed in industrial AI vs traditional automation, but engineers still need to ask what problem is being solved, whether the measurements are credible, whether the pattern makes engineering sense, whether intervention improved the process, and whether performance will remain stable. AI may become a tool inside the investigation. It does not eliminate the improvement logic.
Common mistakes engineering students make with DMAIC
- Starting with the solution. "We need to automate this" is a proposed solution, not a Define statement.
- Measuring everything. Data should answer the project question, not just accumulate.
- Assuming the measuring instrument is correct. Measurement itself contributes variation.
- Using a fishbone diagram as proof. It creates candidate causes, not verified ones.
- Confusing control limits and specification limits. They come from different sources and answer different questions.
- Assuming correlation is causation. A statistical relationship requires engineering interpretation.
- Looking only at averages. Variation matters just as much.
- Improving without a baseline. Then proof of improvement becomes weak.
- Ending at Improve. Without Control, the process may drift back.
- Using statistics without understanding the machine. Numbers must remain connected to engineering mechanisms.
What engineering students should remember
You do not need to become a Six Sigma Black Belt before DMAIC becomes useful — the method teaches several valuable engineering habits that extend far beyond formal Six Sigma projects, and that are worth demonstrating as practical competence, not just describing on paper.
- Define before solving. A poorly defined problem creates wasted effort.
- Measure before assuming. Physical evidence can overturn an initial hypothesis.
- Verify causes. Do not confuse plausibility with proof.
- Understand the measurement system. Bad measurements produce misleading conclusions.
- Separate stability from specification. A predictable process is not necessarily a capable one.
- Improve causes, not symptoms. Corrective action should follow evidence.
- Sustain improvement. The work is not complete if the process immediately returns to its former condition.
Key takeaway
Six Sigma can look complicated when it is introduced through statistical formulas, belt structures and quality terminology. DMAIC makes the core logic much simpler: define exactly what problem you are solving, measure how the process currently behaves, analyze for causes supported by evidence, improve the conditions responsible for the problem, and control so the gain does not disappear.
For engineering students, the most important lesson is not memorizing which chart belongs in which stage. It is developing a disciplined habit of evidence-based problem solving.
“Do not use DMAIC to organize tools. Use tools to answer the questions DMAIC forces you to ask.”
References and further reading
- ISO 13053-1:2011 — Quantitative methods in process improvement — Six Sigma — Part 1: DMAIC methodology. The published international standard for DMAIC methodology, providing recommended practice for the five project phases.
- ASQ — DMAIC Process: Define, Measure, Analyze, Improve, Control. Authoritative overview of the purpose and structure of each DMAIC phase.
- ASQ — Six Sigma. Broader explanation of Six Sigma as a data-driven methodology focused on variation, defects, inputs and outputs.
- ASQ — Statistical Process Control. Useful for common-cause versus special-cause variation and the role of control charts.
- NIST/SEMATECH Engineering Statistics Handbook — Control Charts. Technical reference for statistical process control and the interpretation of control limits.
- NIST/SEMATECH Engineering Statistics Handbook — Process Capability. Technical reference for process capability and the definitions and assumptions behind Cp and Cpk.
- Soares et al. — Gage R&R Studies in Measurement System Analysis: A Systematic Literature Review, Quality Engineering, 2022. Research reference for how measurement-system variability affects manufacturing quality decisions.